Bar charts are best for comparing discrete amounts. They make it easy for our brains to compare relative size.
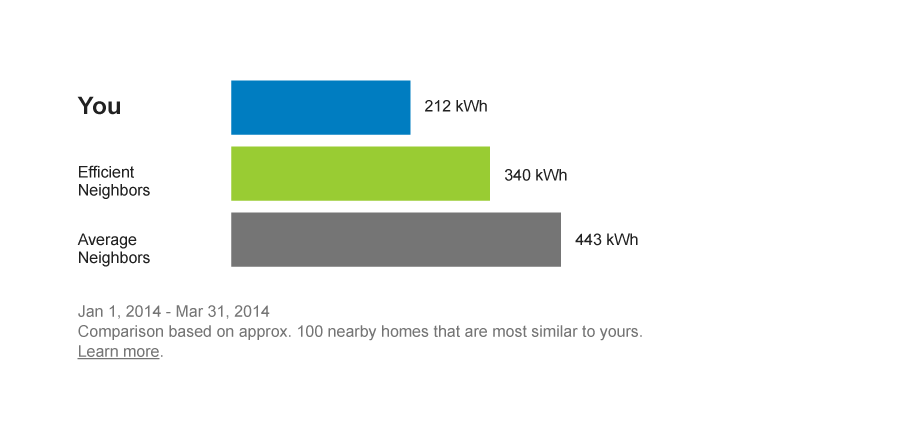
![]() Organize the bars in a meaningful way. Ex: smallest to largest, oldest to newest, alphabetical.
Organize the bars in a meaningful way. Ex: smallest to largest, oldest to newest, alphabetical.
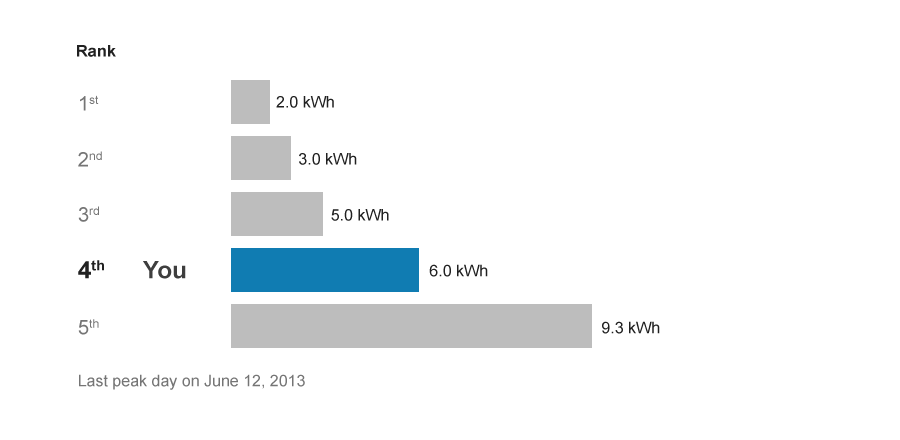
![]() Draw attention to the most important aspect of the chart.
Draw attention to the most important aspect of the chart.
![]() Don’t make up stuff. If a data point is missing, leave a space for the bar and add a footnote. If more than 2 out of 10 bars are missing, don’t make a bar chart.
Don’t make up stuff. If a data point is missing, leave a space for the bar and add a footnote. If more than 2 out of 10 bars are missing, don’t make a bar chart.
![]() If needed, include a descriptive caption. Write it as a full sentence.
If needed, include a descriptive caption. Write it as a full sentence.
![]() Don’t use vertical grid lines.
Don’t use vertical grid lines.
Wondering if you’re using the right type of chart? See the side-by-side comparison.