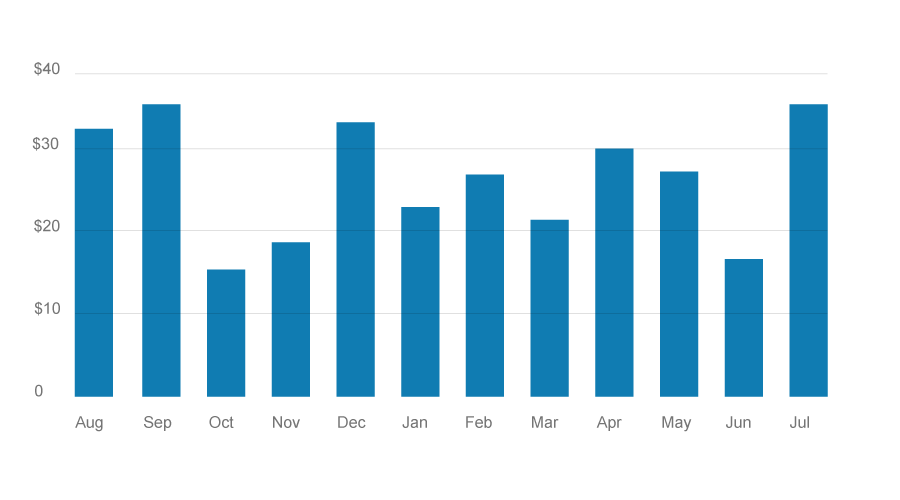
Column charts compare discrete amounts over time. Like bar charts, column charts show specific amounts—each column represents a clear end point.
![]() Start at zero baseline.
Start at zero baseline.
![]() Use light horizontal grid lines to help guide the eye across multiple columns.
Use light horizontal grid lines to help guide the eye across multiple columns.
![]() Figure out what the most important aspect of the chart is, and call attention to that.
Figure out what the most important aspect of the chart is, and call attention to that.
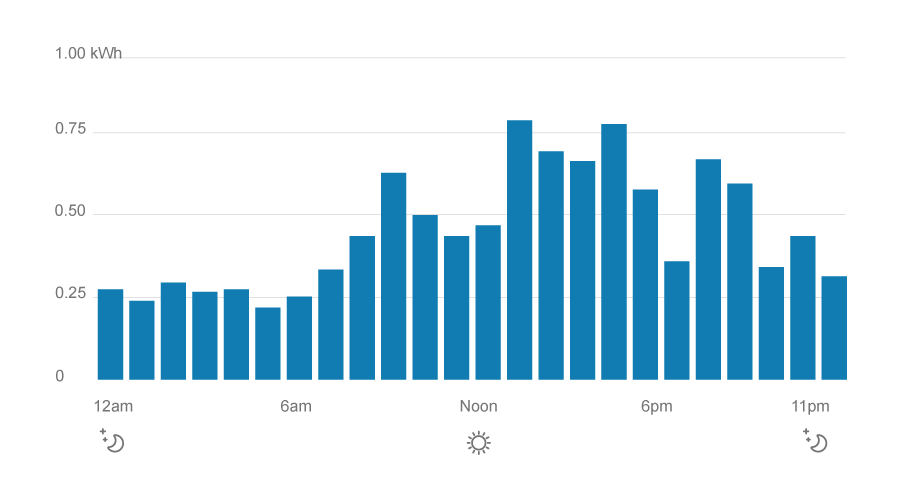
![]() Choose logical increments.
Choose logical increments.
![]() Avoid placing labels on an angle. If labels don’t fit, try horizontal bars instead.
Avoid placing labels on an angle. If labels don’t fit, try horizontal bars instead.
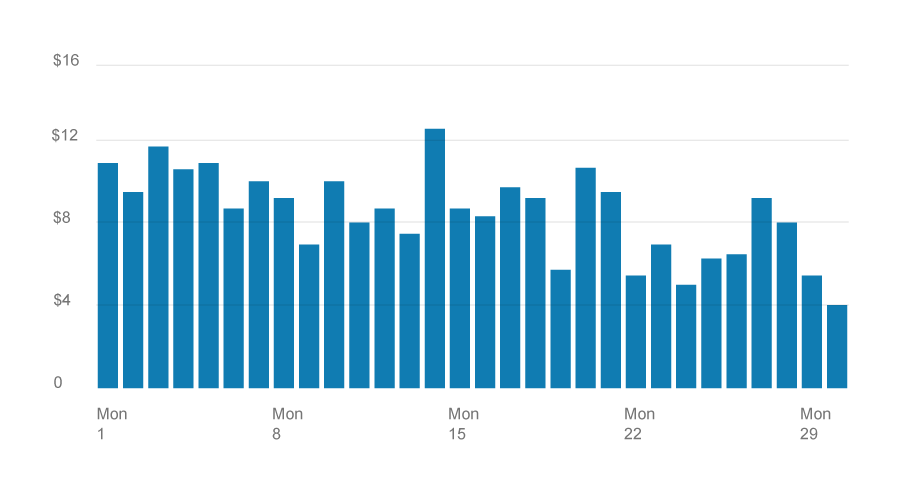
![]() Don’t show more than 30 columns in a single chart.
Don’t show more than 30 columns in a single chart.
Wondering if you’re using the right type of chart? See the side-by-side comparison.